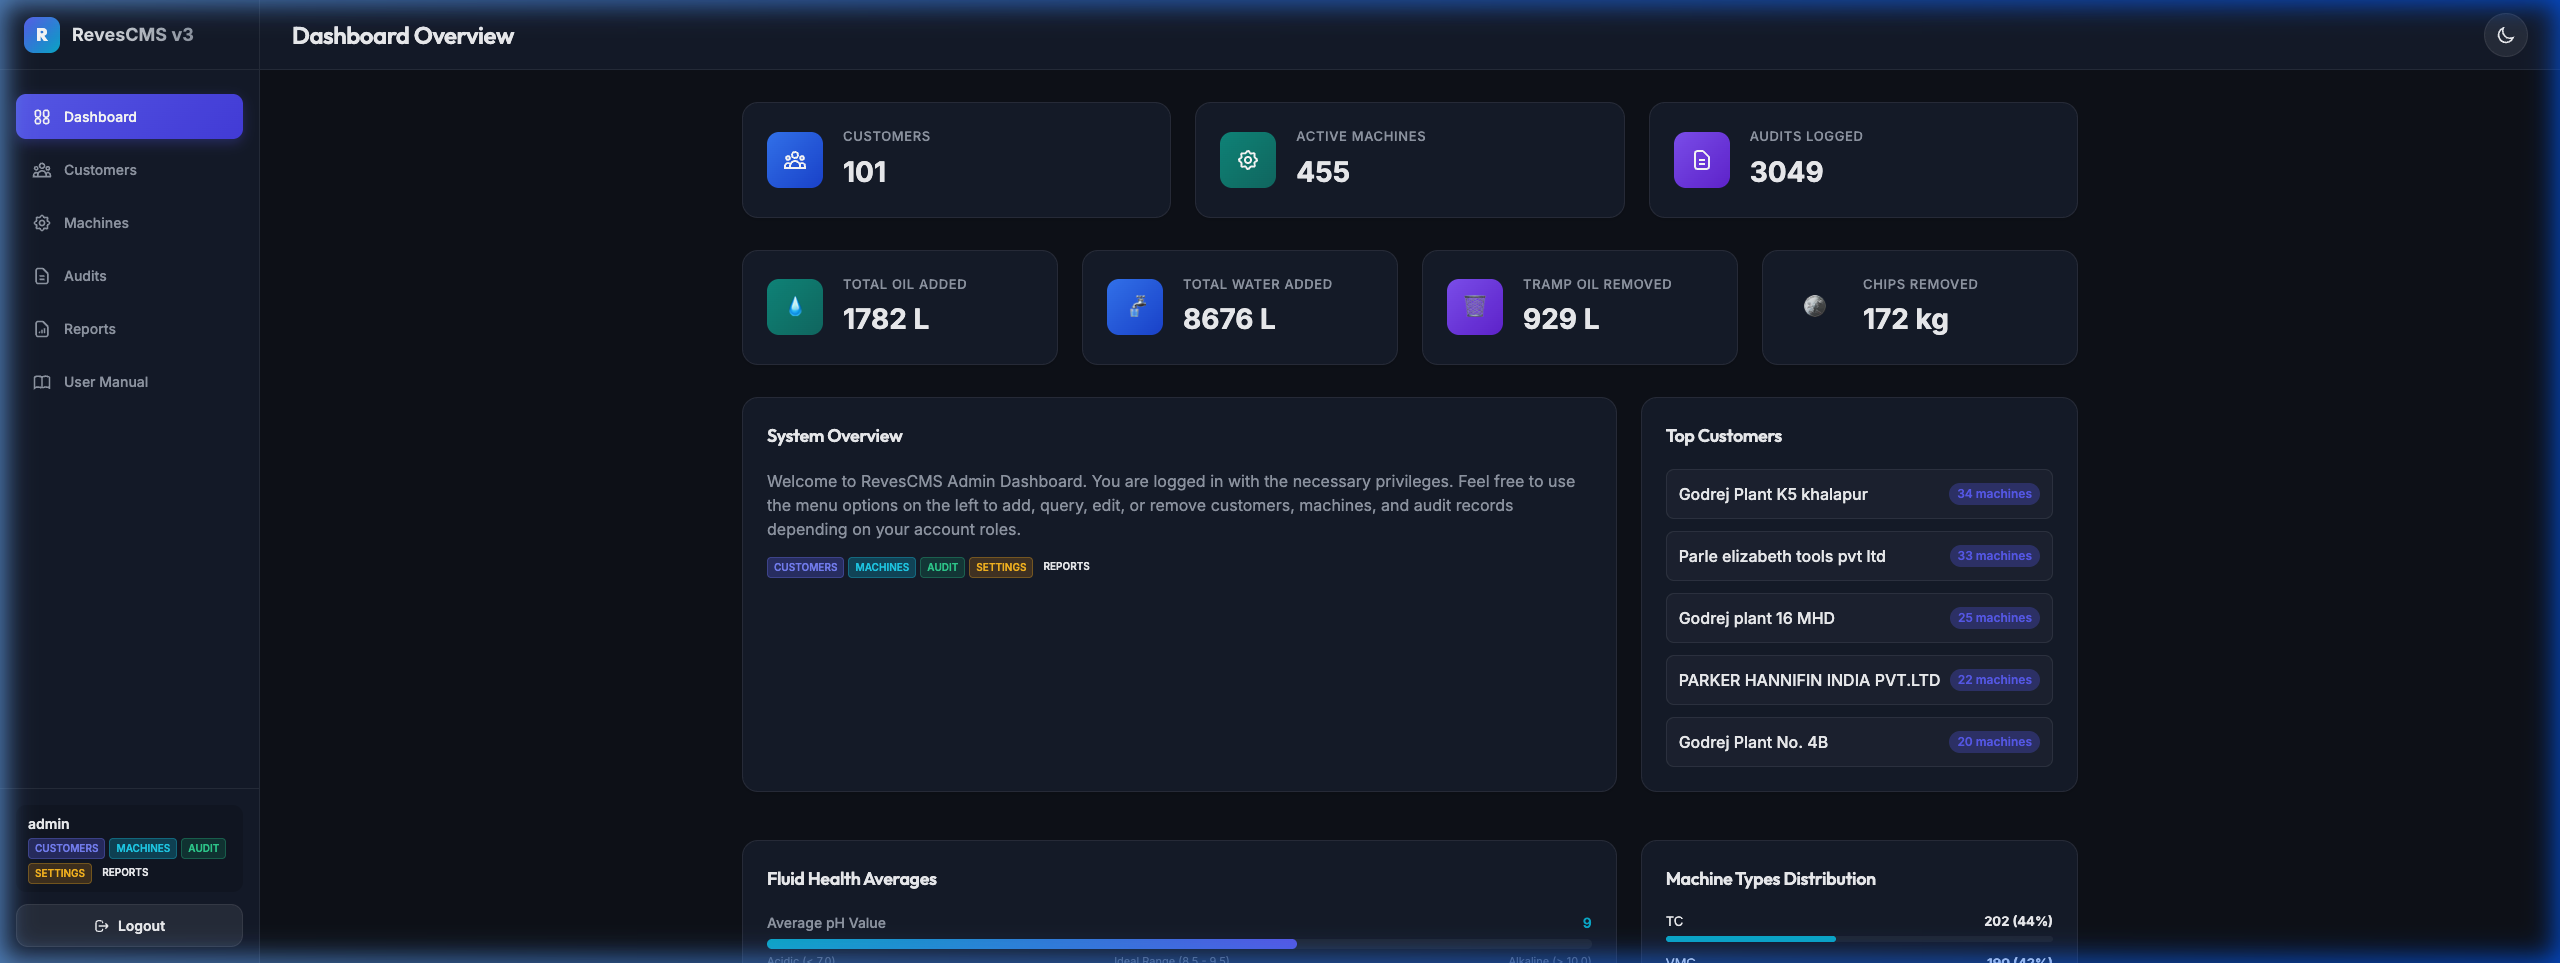
Dashboard Overview

Customers -
Active Machines -
Audits Logged -
💧
Total Oil Added -
🚰
Total Water Added -
🗑️
Tramp Oil Removed -
🪙
Chips Removed -

System Overview

Welcome to RevesCMS Admin Dashboard. You are logged in with the necessary privileges. Feel free to use the menu options on the left to add, query, edit, or remove customers, machines, and audit records depending on your account roles.

Top Customers

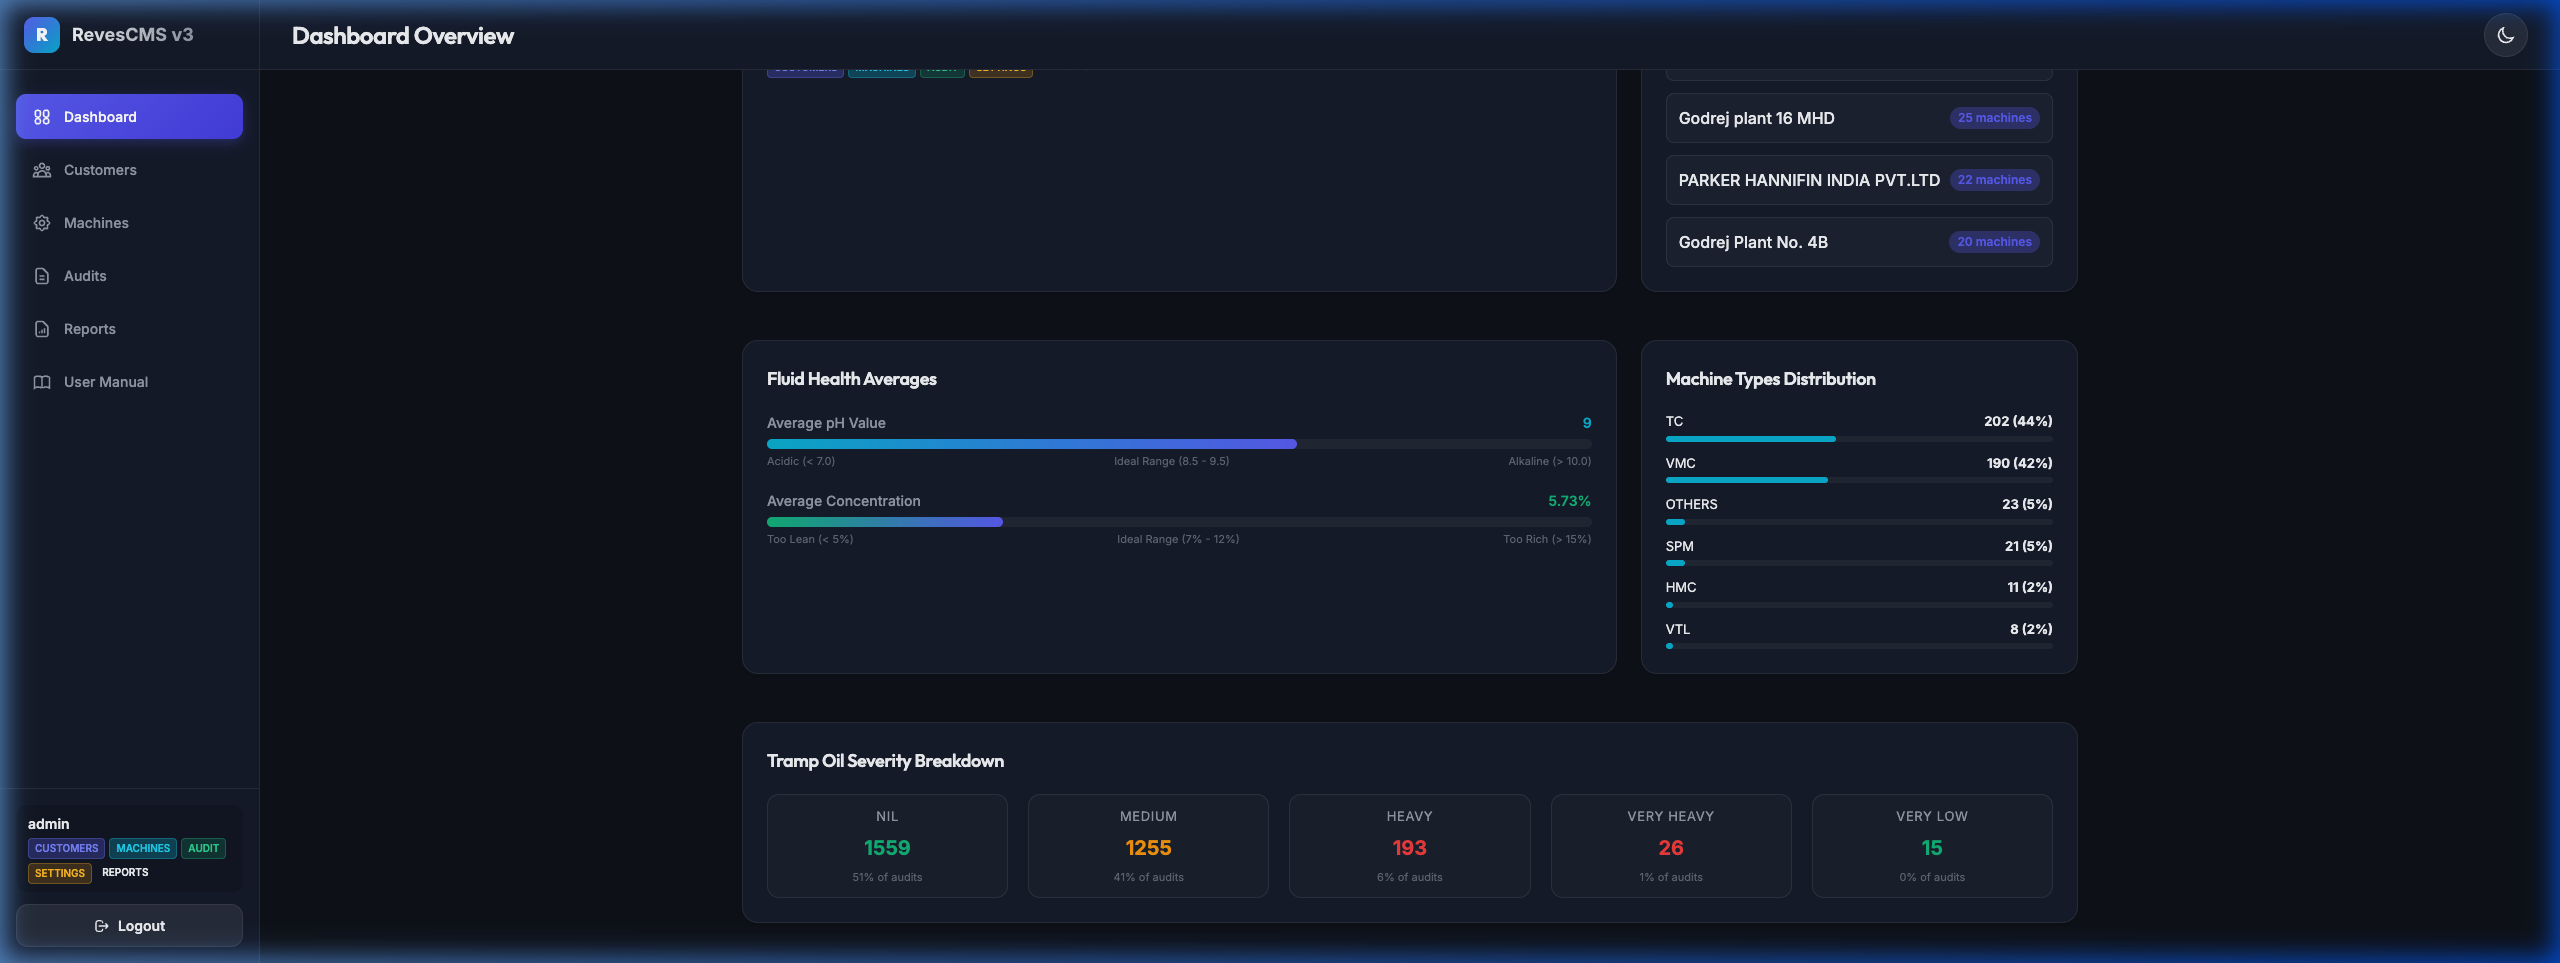
Fluid Health Averages

Average pH Value -
Acidic (< 7.0) Ideal Range (8.5 - 9.5) Alkaline (> 10.0)
Average Concentration -
Too Lean (< 5%) Ideal Range (7% - 12%) Too Rich (> 15%)

Machine Types Distribution

Tramp Oil Severity Breakdown

ID Customer Name Location Contact Name Phone / Email Department HOD Actions
Code Customer Make & Type Tank Details Conveyor Details Filtration Unit Coolant & Skimmer Paper Actions
Date Machine Customer Concentration pH Tramp Oil Additions Tramp Oil Rem. Chips Rem. Color Comments Actions

Generate Reports

Onsite Visit Logs

Record and view detailed maintenance workflows and SOPs.

Start:
End:
Date Customer Machine Code Work Type Reves Rep Customer Rep Actions
📖

RevesCMS v3 — User Manual

Welcome to the RevesCMS v3 portal — a coolant management system designed to help you track customers, machines, fluid health audits, and generate analytical reports. This manual walks you through every feature of the portal with step-by-step instructions and screenshots.

💡 Tip: Use the Contents panel on the left to quickly jump to any section.
🔑

1. Logging In

When you open the portal URL, you will be presented with the login screen. Enter your credentials to access the portal.

1Open the portal URL in your browser: https://appardonix.com/revescmsv3/
2Enter your Username in the first field.
3Enter your Password in the second field.
4Click the "Sign In" button to proceed.
5If credentials are incorrect, an error message will appear in red below the form.
Login Page
Fig 1.1 — Portal Login Screen
⚠️ Note: Your access to various modules depends on the roles assigned to your account. Contact your administrator if you cannot see a menu item.
📊

2. Dashboard

After logging in, you land on the Dashboard. It gives you a real-time summary of your entire operation at a glance.

What you can see on the Dashboard:

👥
Total Customers
Count of all registered customers.
⚙️
Active Machines
Total machines currently tracked.
📋
Audits Logged
Total audit entries in the system.
💧
Resource Totals
Oil added, water added, tramp oil removed, chips removed.
🧪
Fluid Health Averages
Average pH and Concentration across all audits with visual bar indicators.
🏭
Machine Type Distribution
Breakdown of machine categories (VMC, TC, HMC, etc.) with percentages.
🛢️
Tramp Oil Severity
Breakdown of audit records by tramp oil severity level.
🏆
Top Customers
Customers ranked by machine count.
Dashboard Overview
Fig 2.1 — Dashboard Summary Cards
Dashboard Charts
Fig 2.2 — Dashboard Analytics Charts
👥

3. Customers

The Customers module lets you manage all your customer accounts — including their contact details and organisational information.

3.1 Viewing Customers
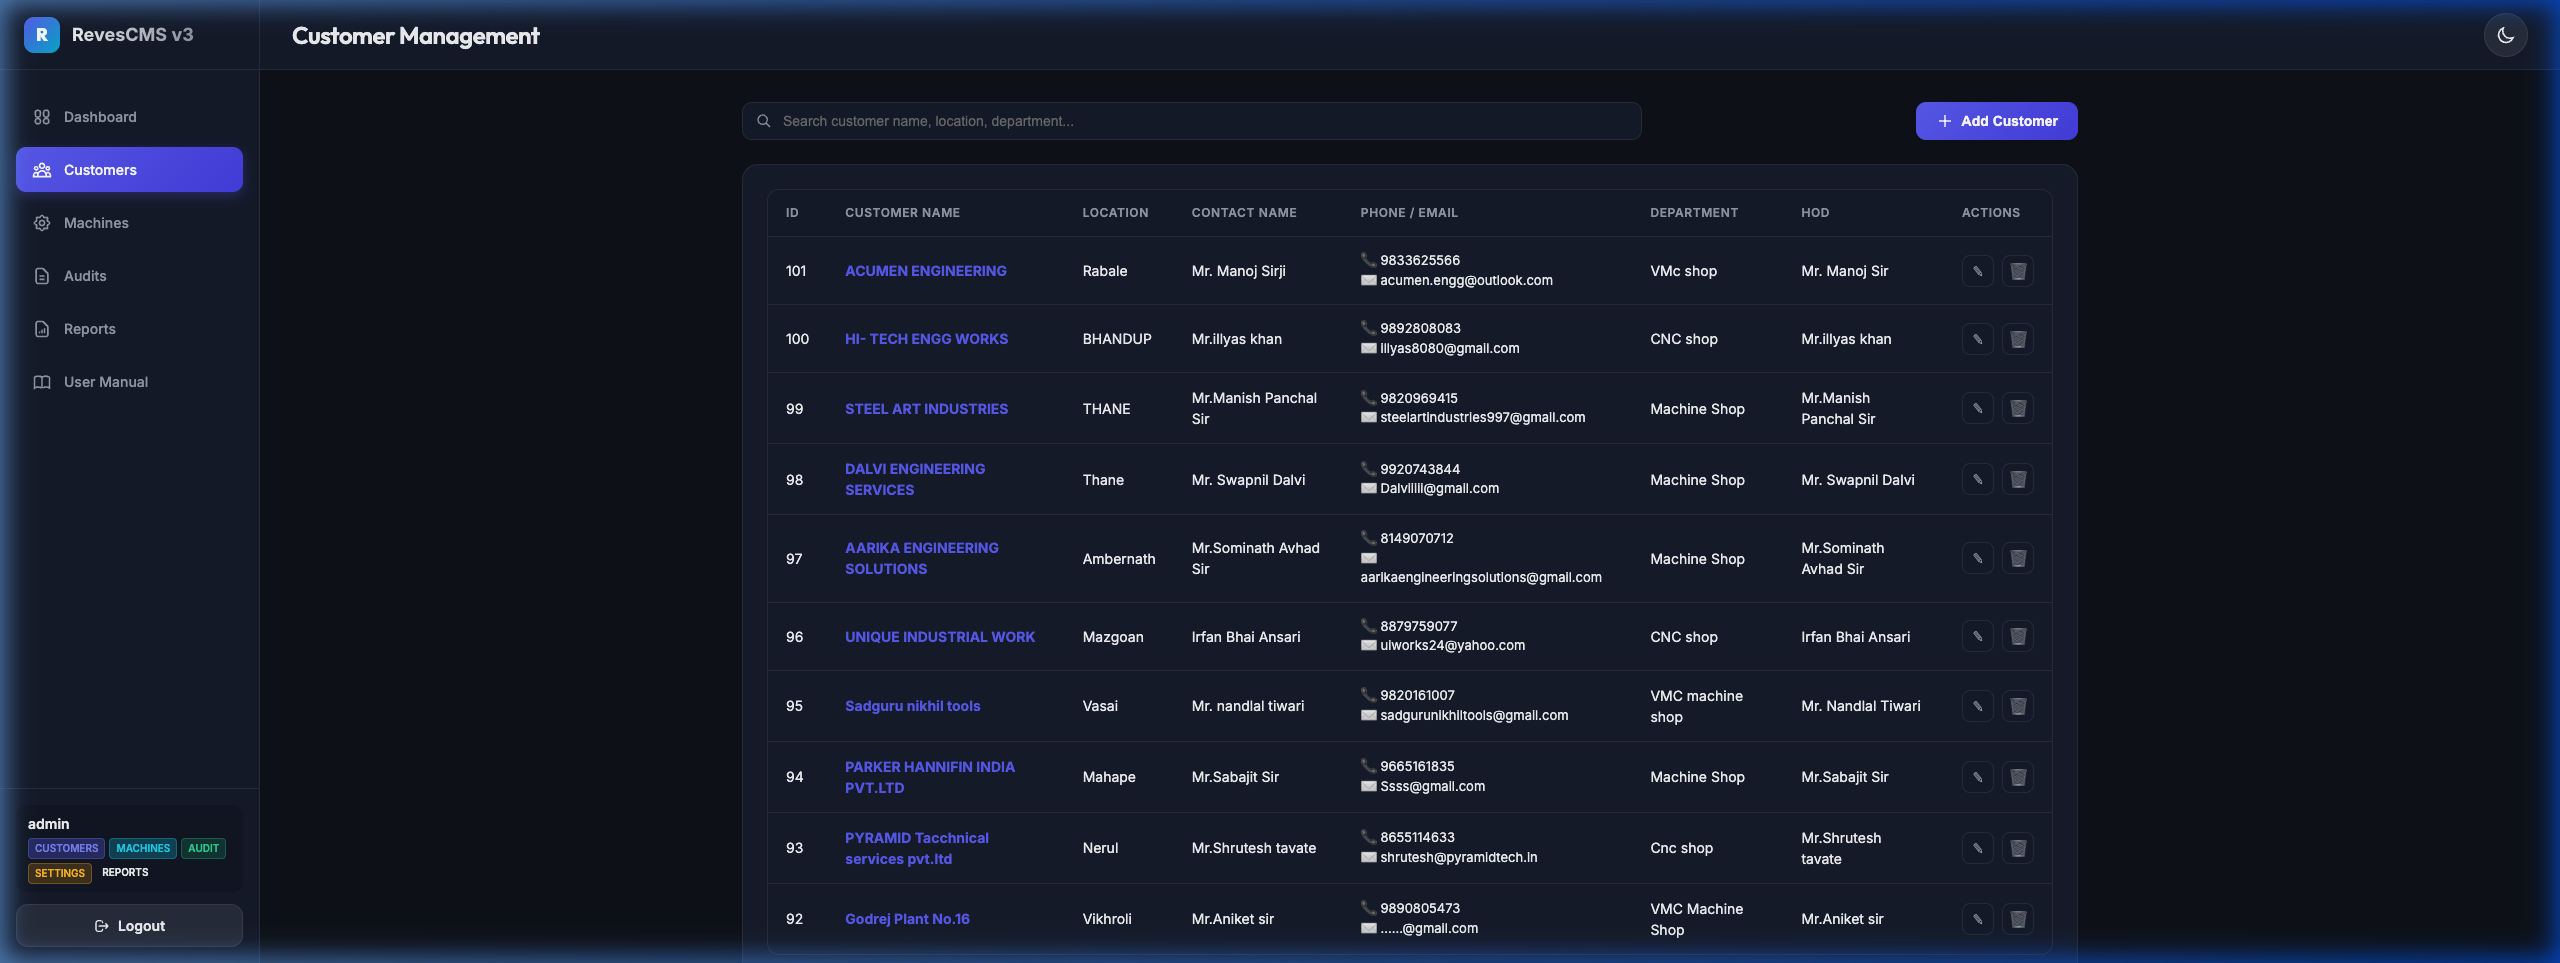
1Click "Customers" in the left sidebar menu.
2The customer list loads. Each row shows the Customer Name, Location, Contact Person, and Phone.
3Use the Search box to filter customers by name, location, or contact.
4Use the pagination controls at the bottom to navigate through pages.
Customers List
Fig 3.1 — Customers List View

3.2 Adding a Customer

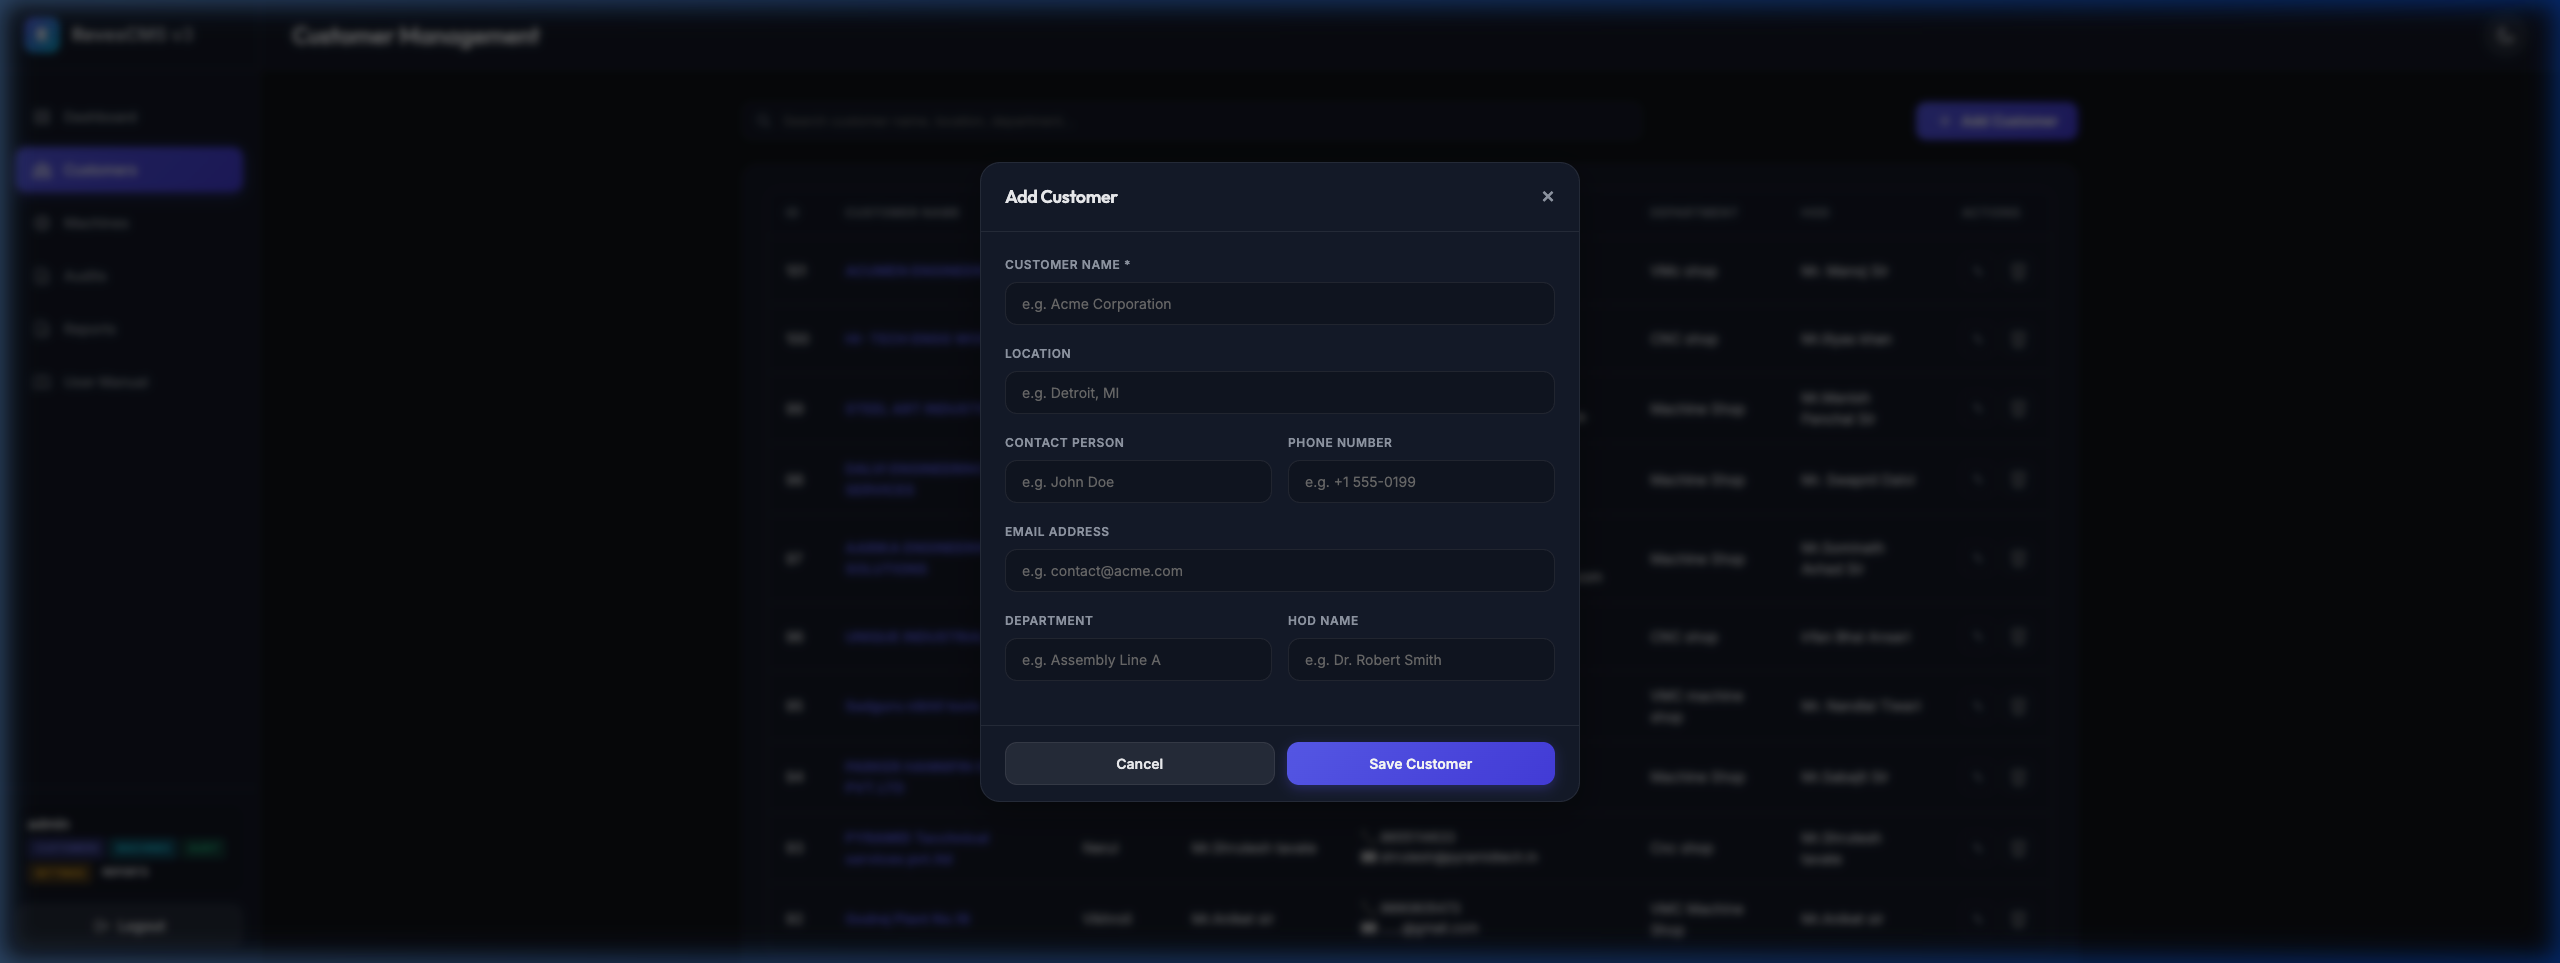
1Click the "+ Add Customer" button in the top right of the Customers page.
2The Add Customer modal will open.
3Fill in all required fields (marked with *): Customer Name is mandatory.
4Optional fields: Location, Contact Name, Phone, Email, Department, HOD Name.
5Click "Save Customer" to create the record. A green success toast will confirm.
Add Customer Modal
Fig 3.2 — Add Customer Modal

3.3 Editing a Customer

1In the customers list, click the Edit (✏️) icon on the right of any row.
2The Edit Customer modal opens with all existing data pre-filled.
3Modify the desired fields and click "Save Customer".

3.4 Deleting a Customer

1Click the Delete (🗑️) icon on the right of any customer row.
2A confirmation dialog appears, warning that all machines and audits linked to this customer will also be deleted.
3Click "Delete" to permanently remove the customer, or "Cancel" to abort.
⛔ Warning: Deleting a customer is irreversible and will cascade-delete all associated machines and audit records.
⚙️

4. Machines

The Machines module tracks all coolant-using machines registered under your customers.

4.1 Viewing Machines
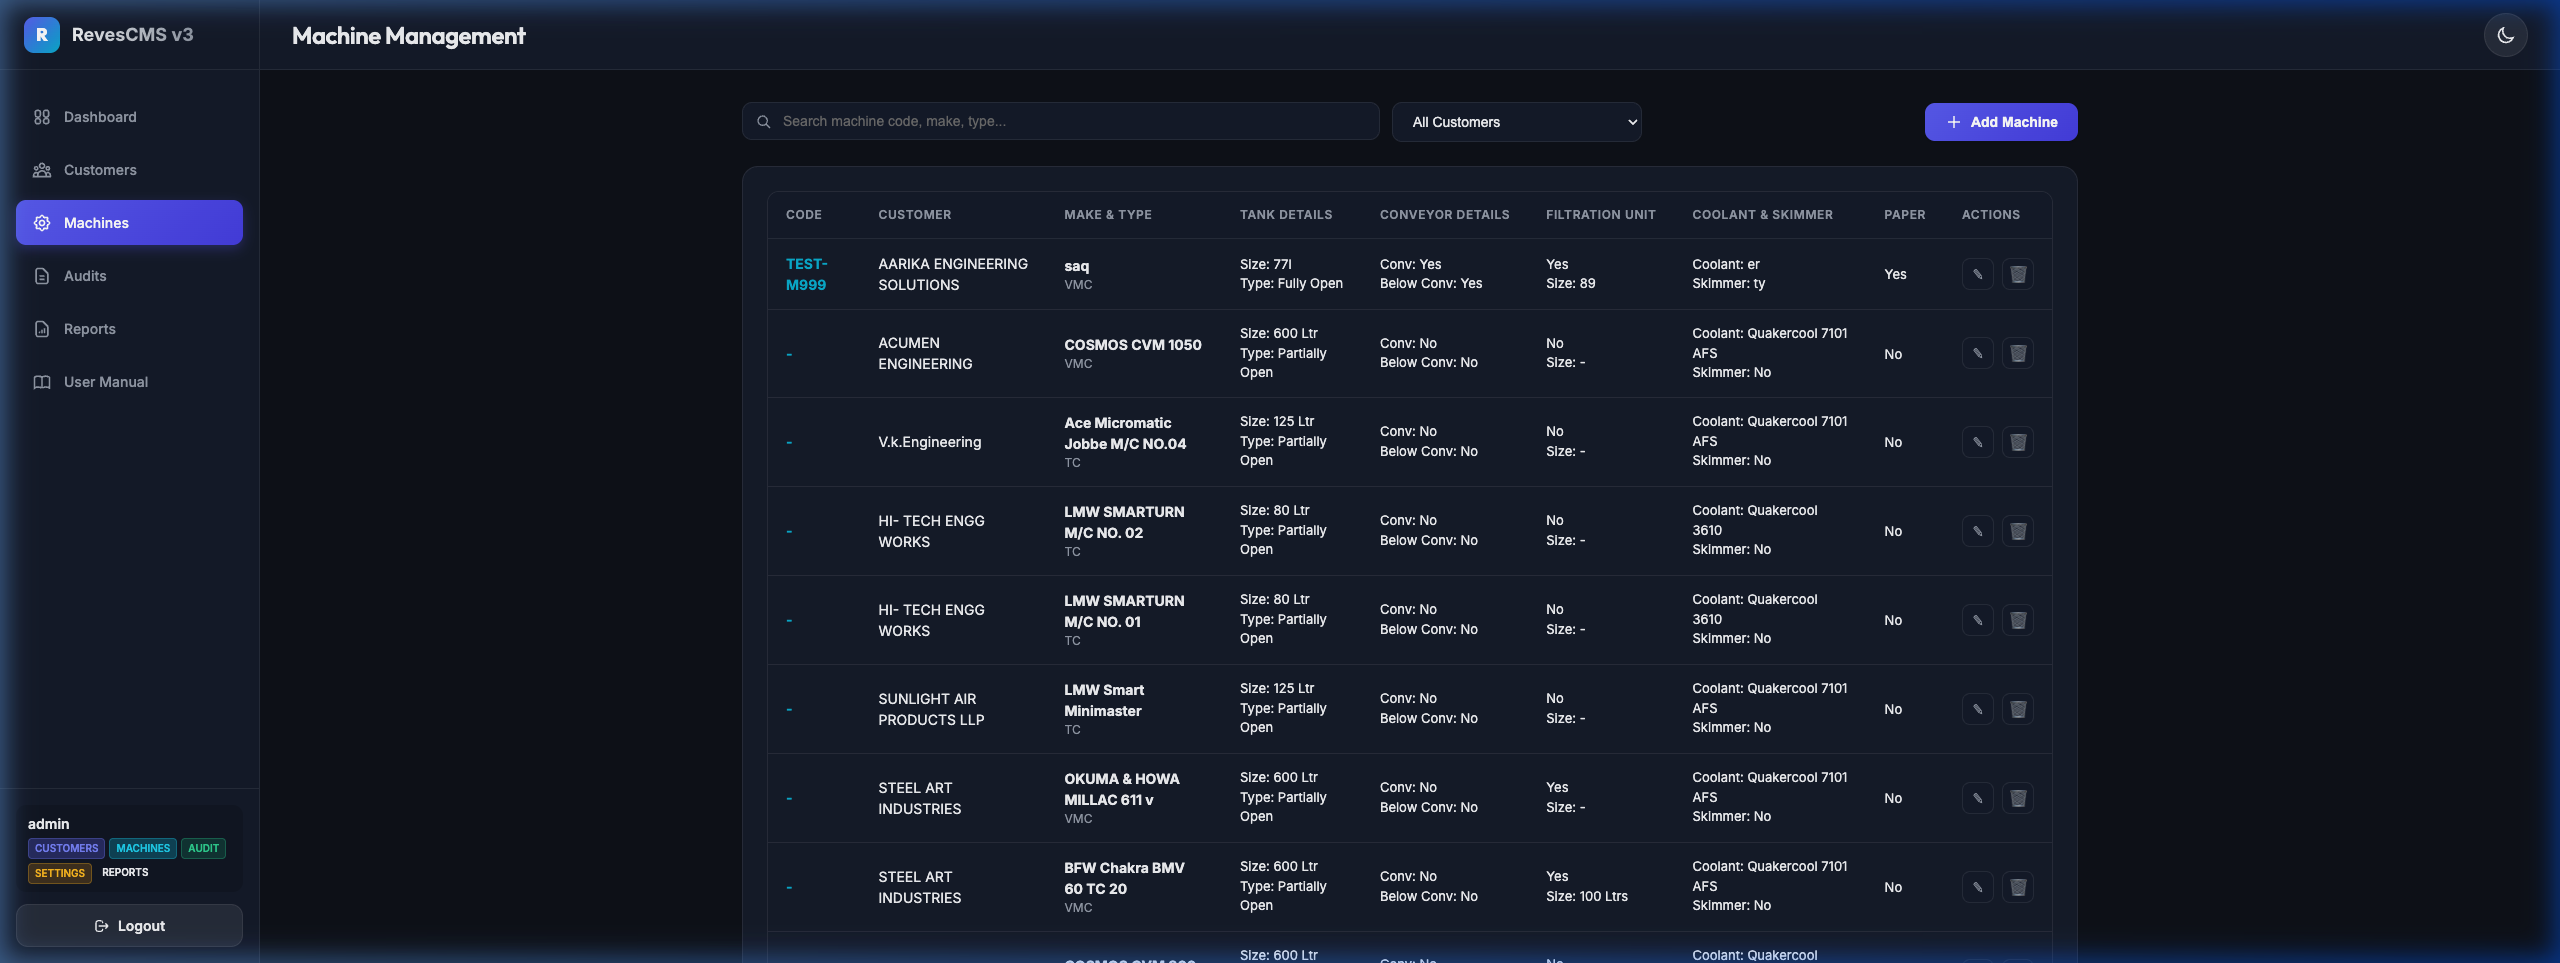
1Click "Machines" in the left sidebar.
2Use the Customer filter dropdown at the top to narrow down machines for a specific customer.
3Use the Search box to filter by machine code, make, type, or coolant brand.
Machines List
Fig 4.1 — Machines List View

4.2 Adding a Machine

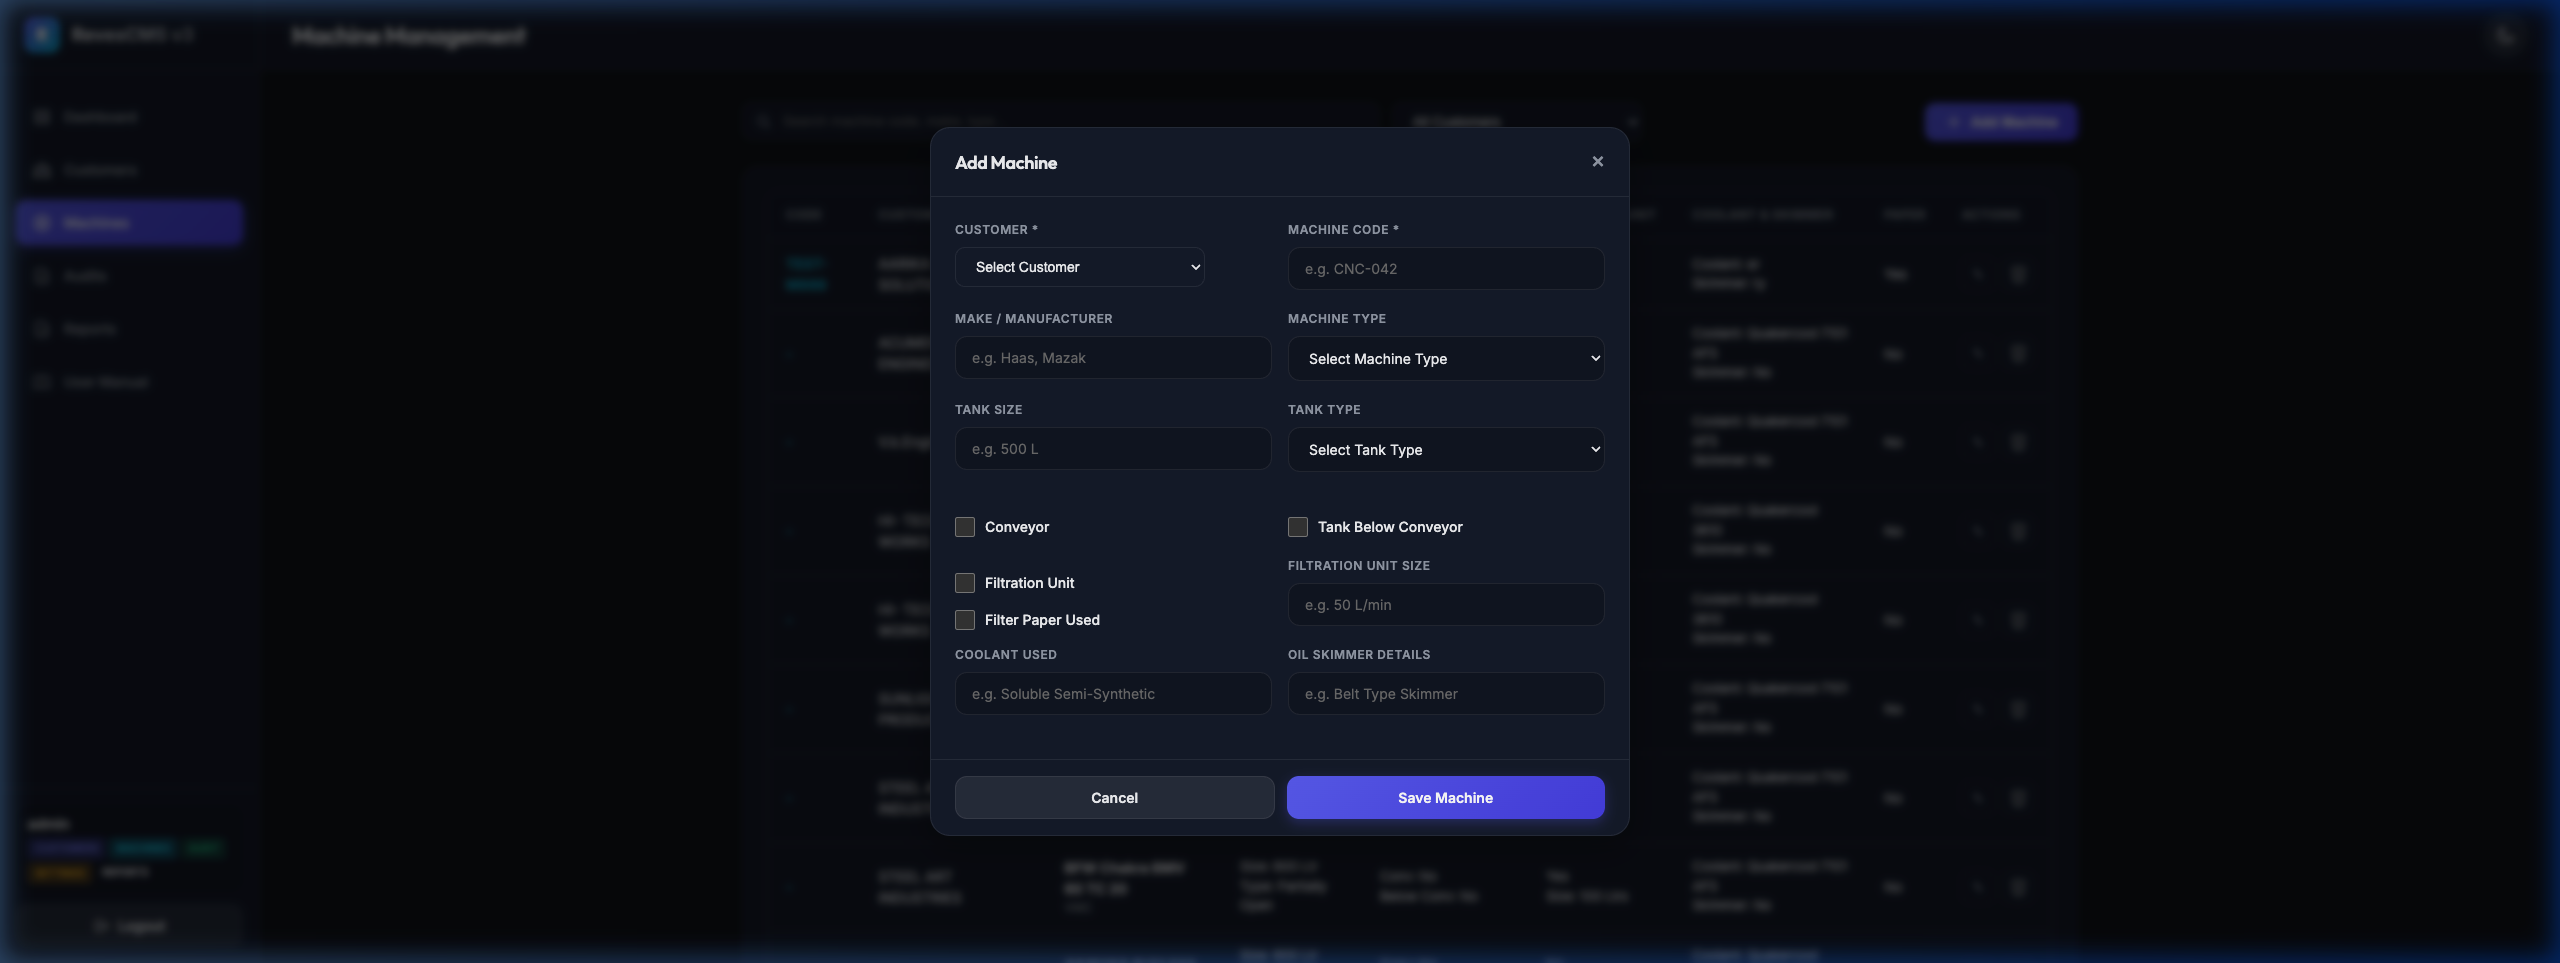
1Click "+ Add Machine" button.
2Select the Customer this machine belongs to from the dropdown. If you already filtered by a customer on the main page, it will be pre-populated.
3Enter the Machine Code — a unique identifier for the machine (e.g., MH-001).
4Select the Machine Type from the dropdown: VMC, HMC, TC, SPM, VTM, or OTHERS.
5Select the Tank Type: Fully Open, Partially Open, or Blocked.
6Check Conveyor, Tank Below Conveyor, Filtration Unit, and Filter Paper Used checkboxes as applicable.
7Fill in Tank Size, Coolant Brand, Oil Skimmer, and Filtration Unit Size as needed.
8Click "Save Machine" to create the record.
Add Machine Modal
Fig 4.2 — Add Machine Modal

4.3 Editing a Machine

1Click the Edit (✏️) icon in the machine row.
2All current values are pre-filled — including checkboxes (checked if Yes, unchecked if No).
3Make your changes and click "Save Machine".
📋

5. Audits

The Audits module is the core of RevesCMS. Every coolant health check performed on a machine is logged here as an audit entry.

5.1 Viewing Audits
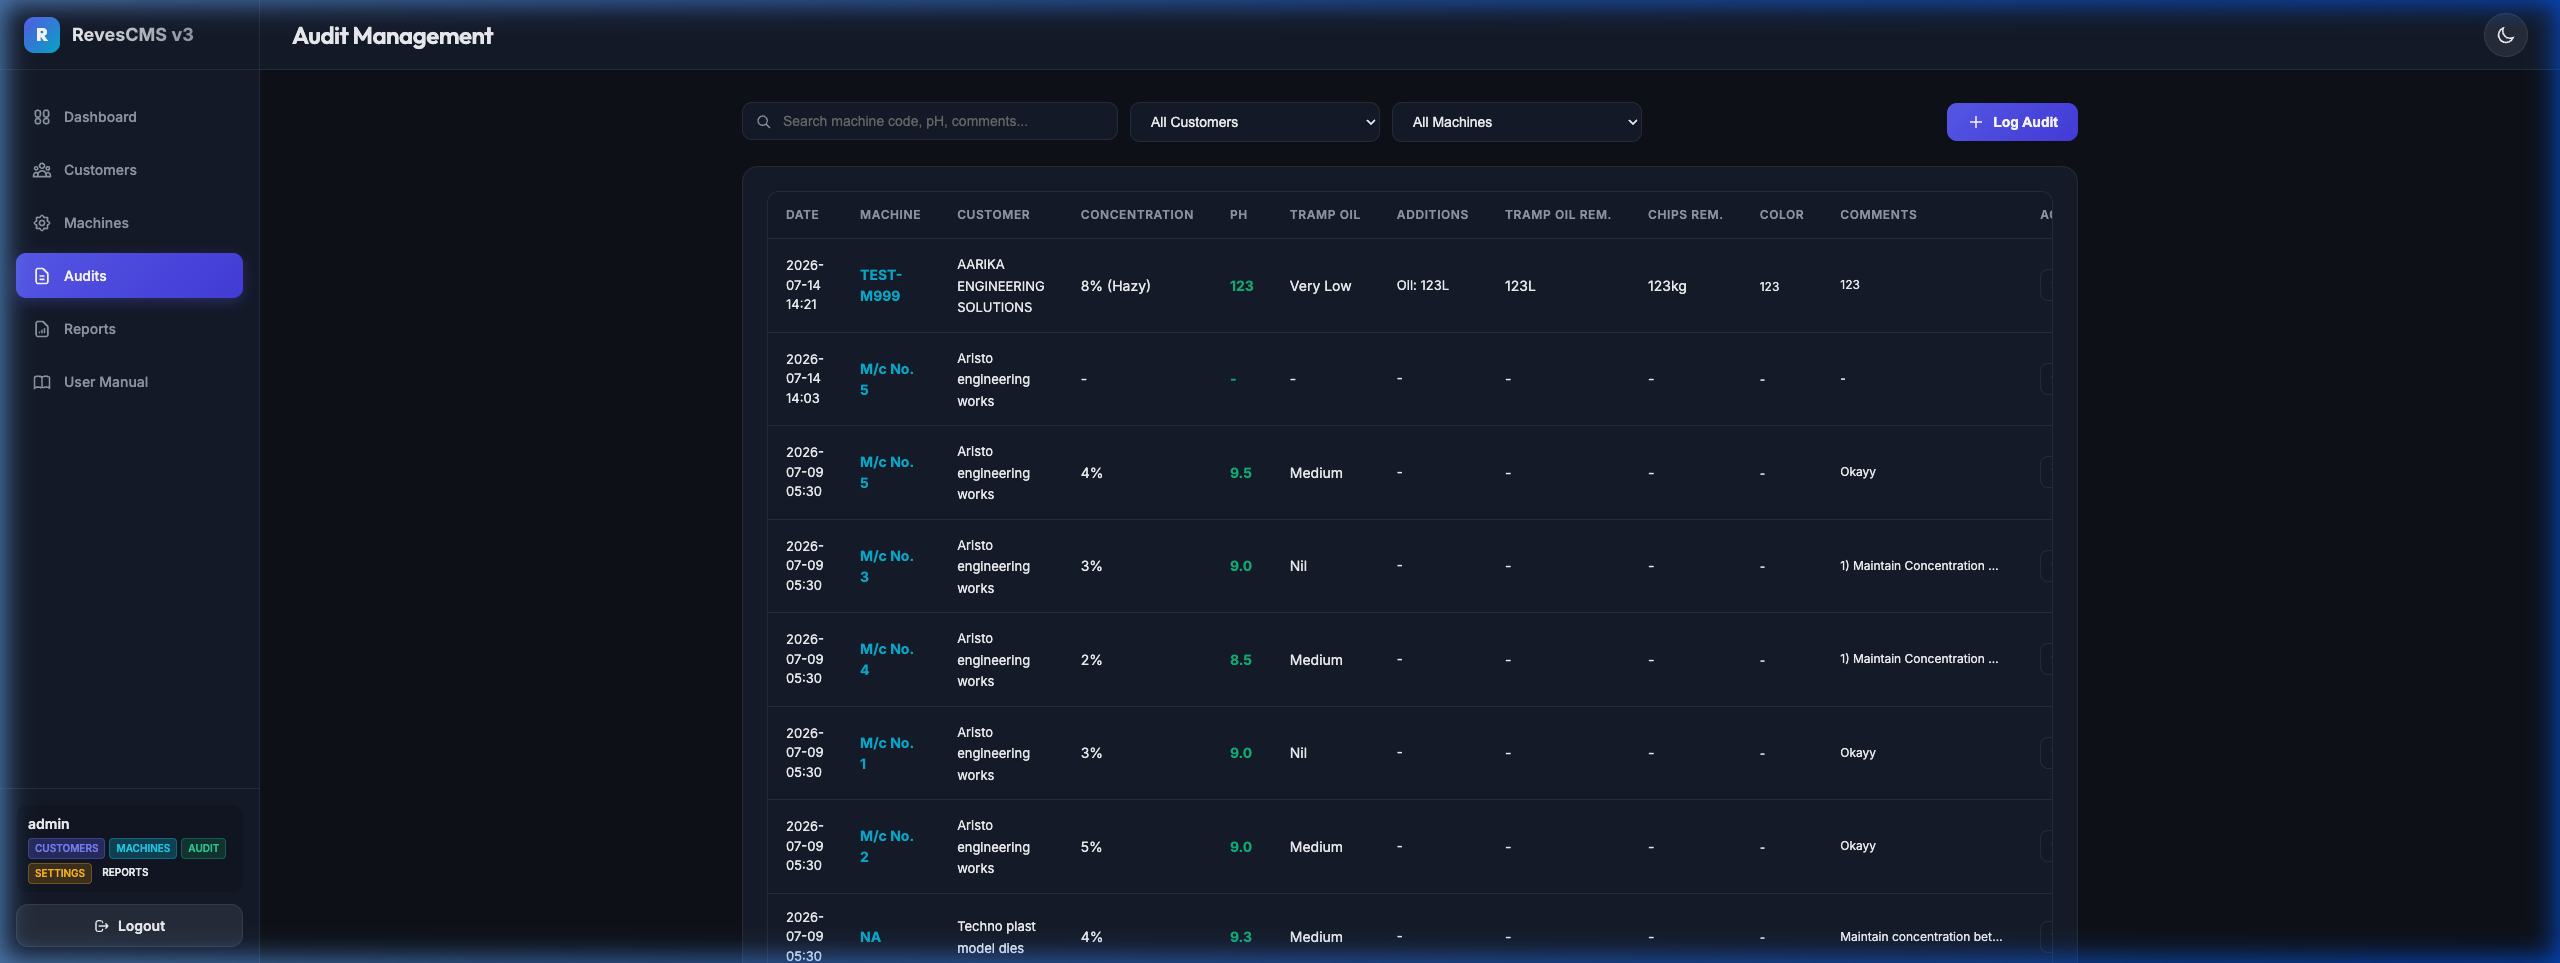
1Click "Audits" in the left sidebar.
2Use the Customer and Machine dropdowns to filter audit records.
3Use Start Date and End Date to view audits logged within a date range.
4Click "Search" to apply filters.
Audits List
Fig 5.1 — Audits List View

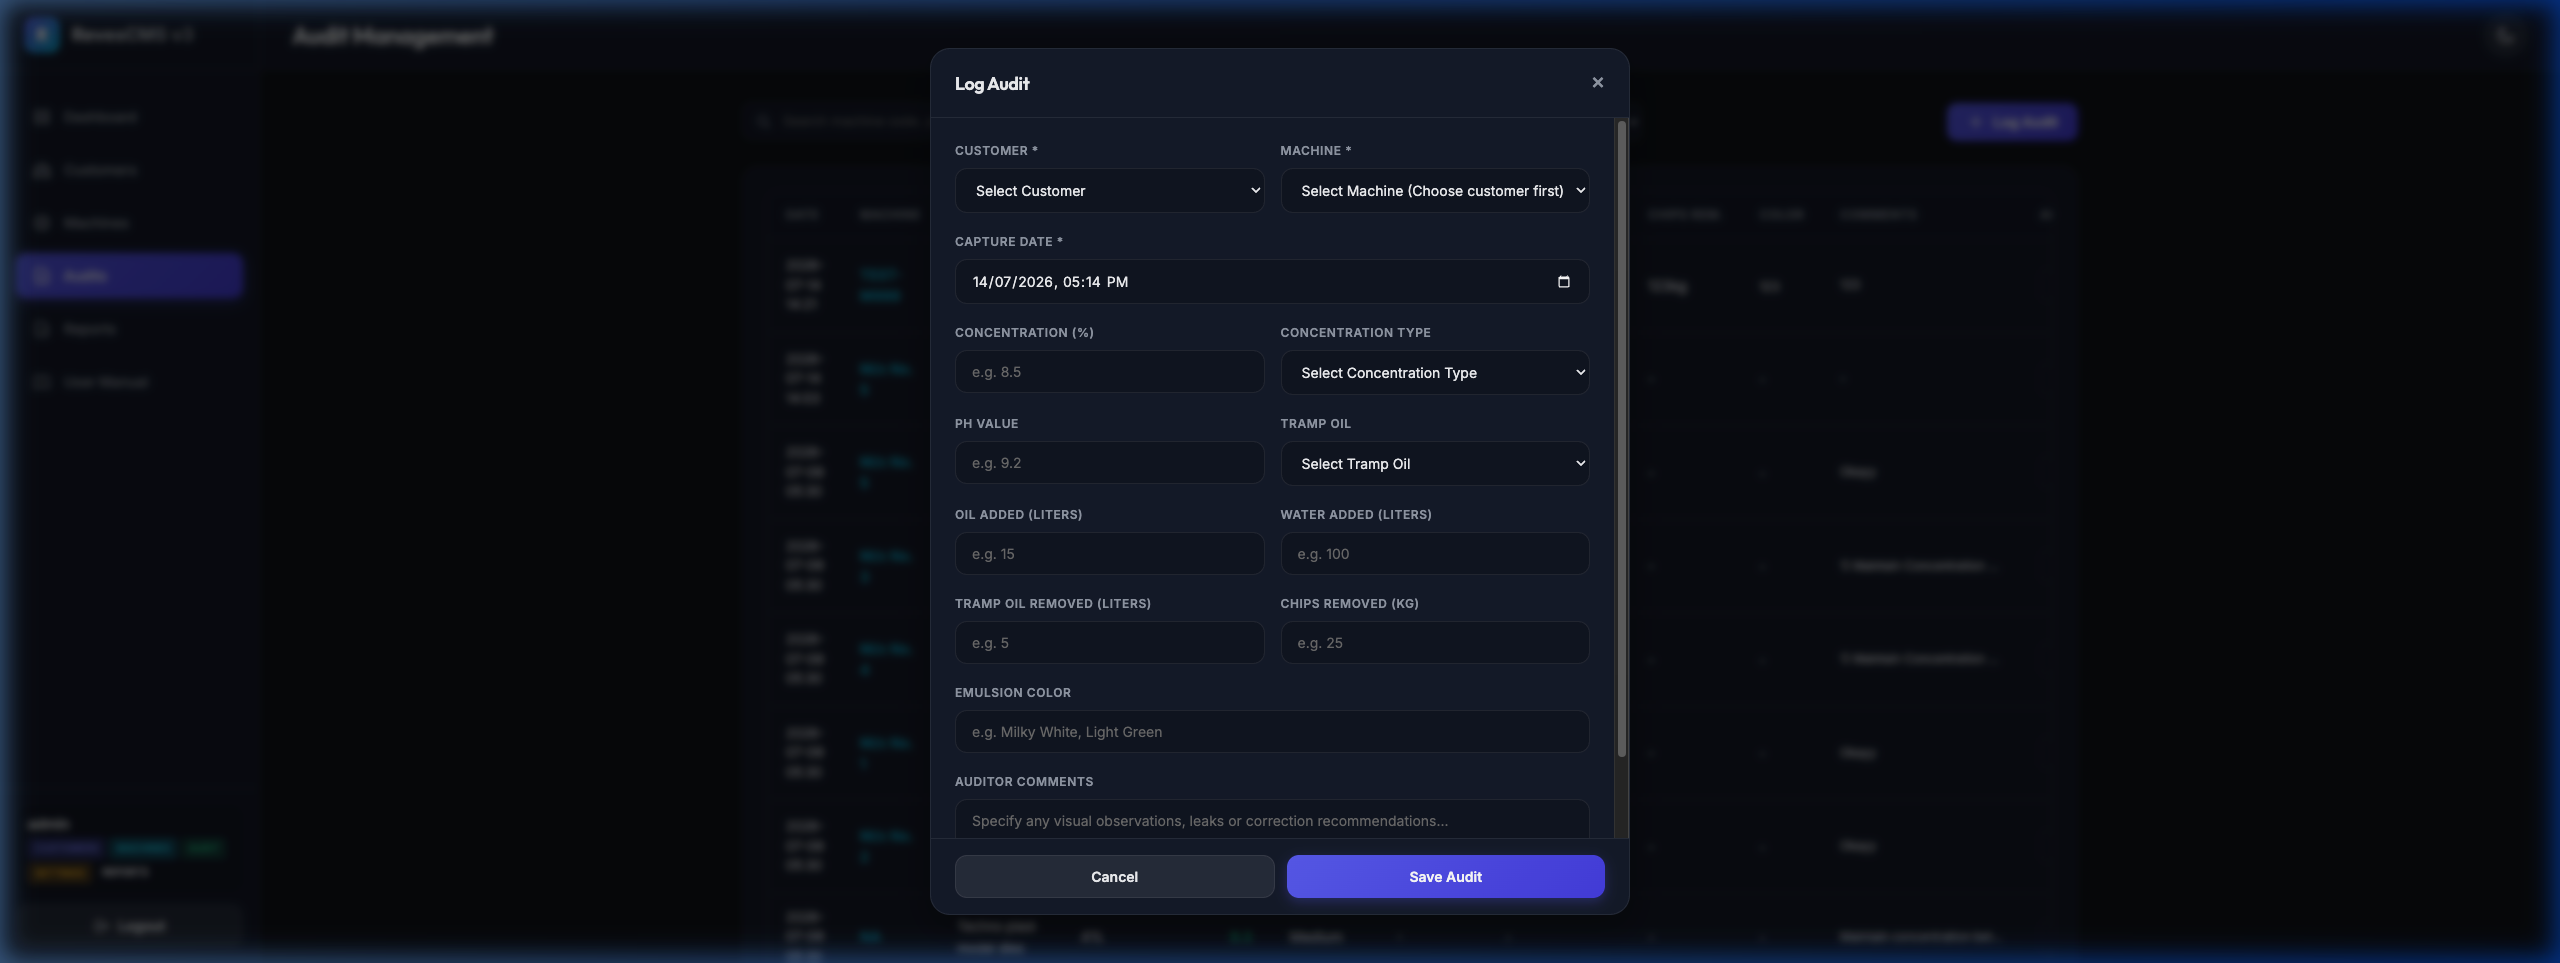
5.2 Logging an Audit

1Click the "+ Log Audit" button.
2Select the Customer from the dropdown. The Machine dropdown will update to show only that customer's machines.
3Select the Machine. If you filtered the Audits page by customer/machine, these are pre-populated automatically.
4Set the Capture Date — the date and time when this audit was taken.
5Fill in all measurement fields (see Section 5.3 below).
6Add any Auditor Comments for observations or recommendations.
7Click "Save Audit" to log the entry.
Log Audit Modal
Fig 5.2 — Log Audit Modal

5.3 Audit Fields Reference

FieldDescriptionTypical Values
Concentration (%)Coolant concentration measured by refractometer5–15 %
Concentration TypeVisual appearance of the emulsionClear, Hazy, Very Hazy
pH ValueAlkalinity of the coolant8.5–9.5 (ideal)
Tramp OilContamination level of tramp/hydraulic oilNil, Very Low, Medium, Heavy, Very Heavy
Oil Added (L)Coolant concentrate added during this visite.g. 2.5
Water Added (L)Water added to top up the coolant tanke.g. 10
Tramp Oil Removed (L)Volume of tramp oil skimmed/removede.g. 1.5
Chips Removed (kg)Metal chips/swarf cleaned from the tanke.g. 5
Emulsion ColorVisual colour of the coolant emulsionMilky White, Light Green
Auditor CommentsFree-text observations and recommendationsAny notes
📈

6. Reports

The Reports module lets you generate tailored data extracts and download them as Excel (.xlsx) or PDF files.

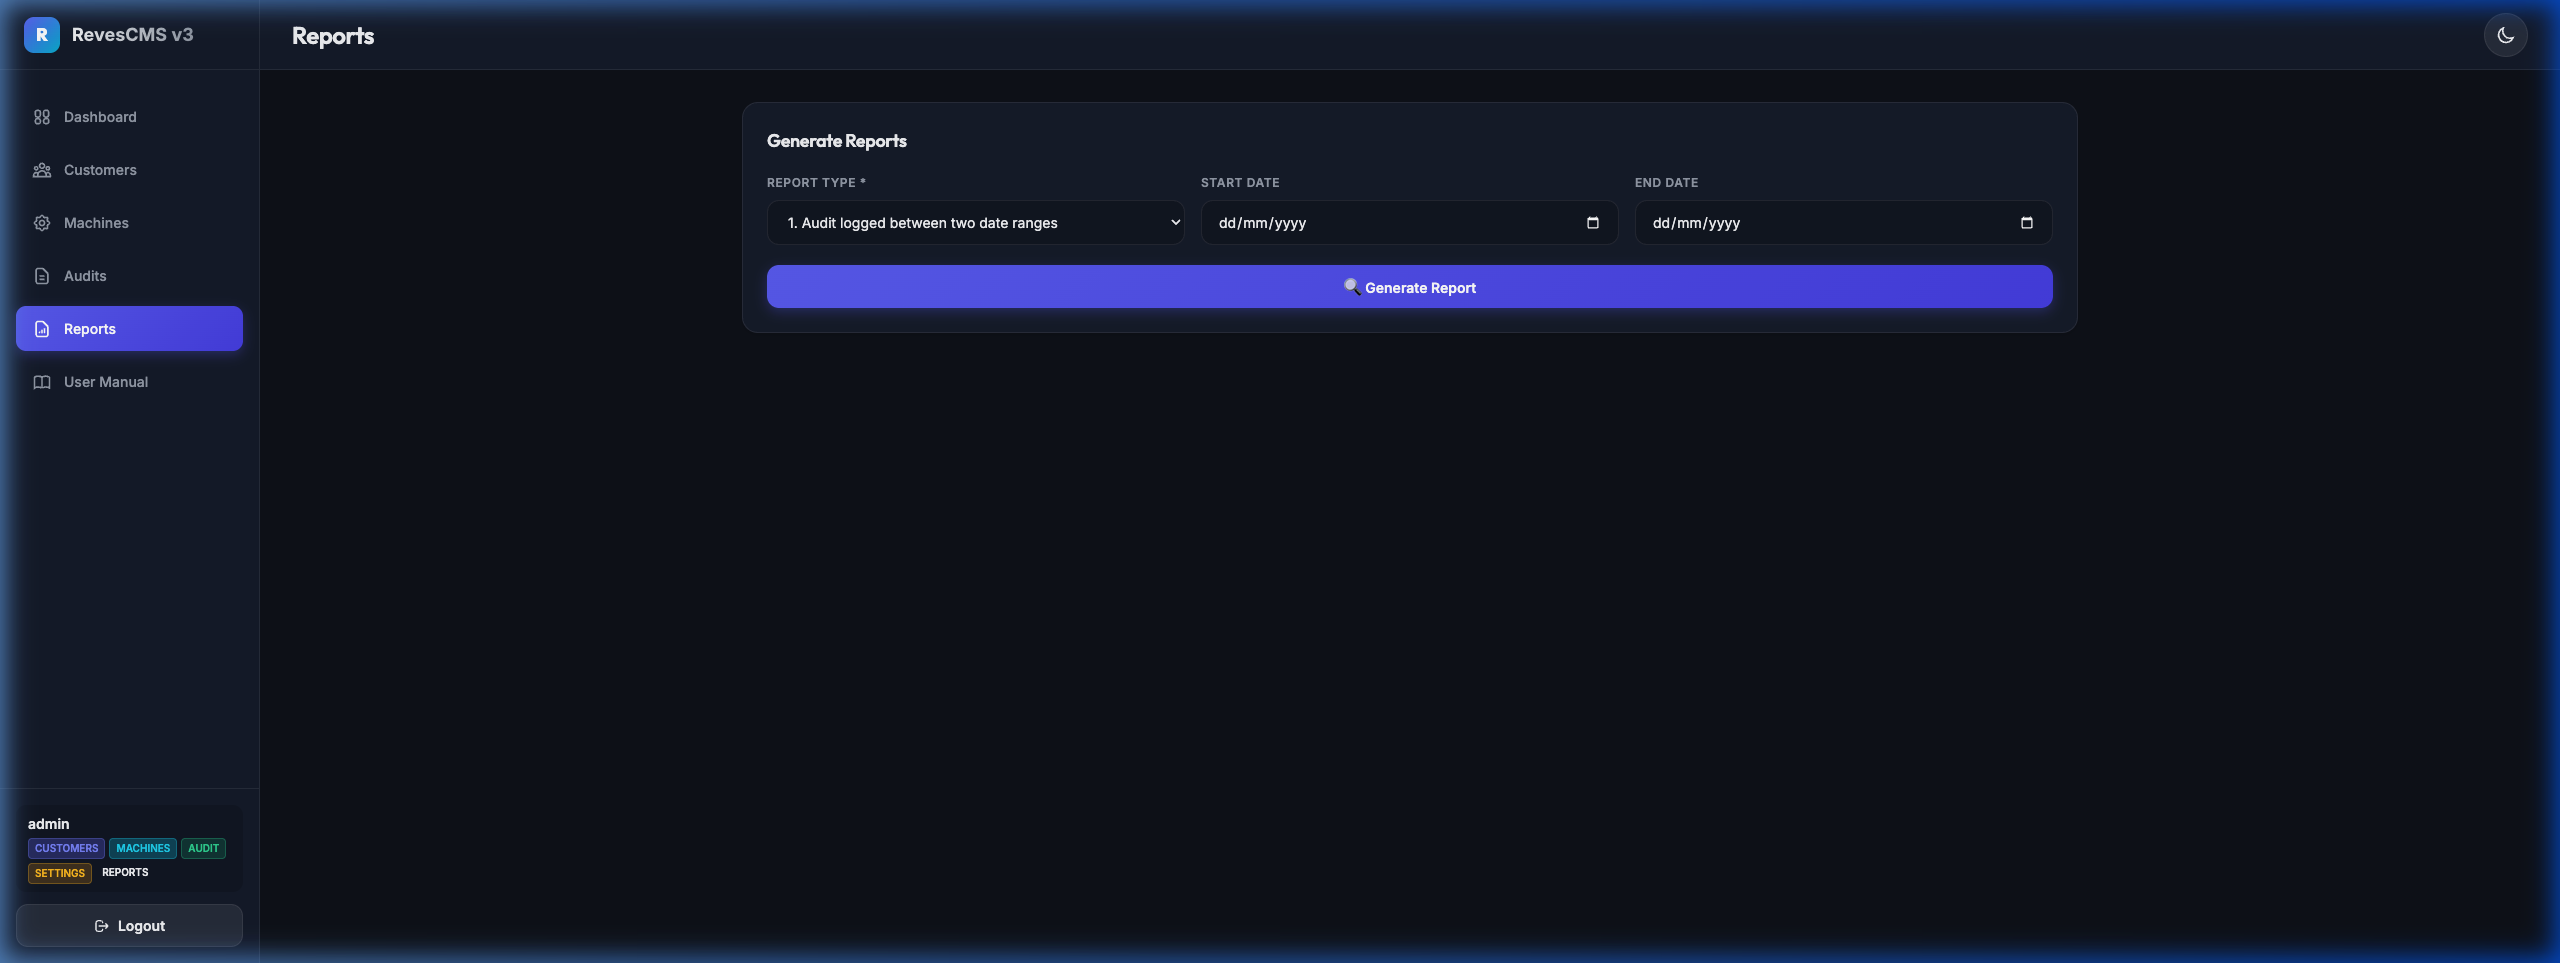
6.1 Report Types

1Click "Reports" in the left sidebar.
2Select a Report Type from the dropdown. The available filter inputs will update automatically.
3Fill in the required filters (Customer, Machine, Start/End Dates as applicable).
4Click "🔍 Generate Report" to run the query and preview the results.
#Report NameRequired Filters
1Audit logged between two date rangesStart Date, End Date
2Audit logged for a given customer between two date rangesCustomer, Start Date, End Date
3Audit logged for a given customer and machine between two date rangesCustomer, Machine, Start Date, End Date
4Total number of machines owned by a given customerCustomer
5Customers created during the given date rangeStart Date, End Date
6Machines created during a given date rangeStart Date, End Date
Reports Page
Fig 6.1 — Reports Filter Panel
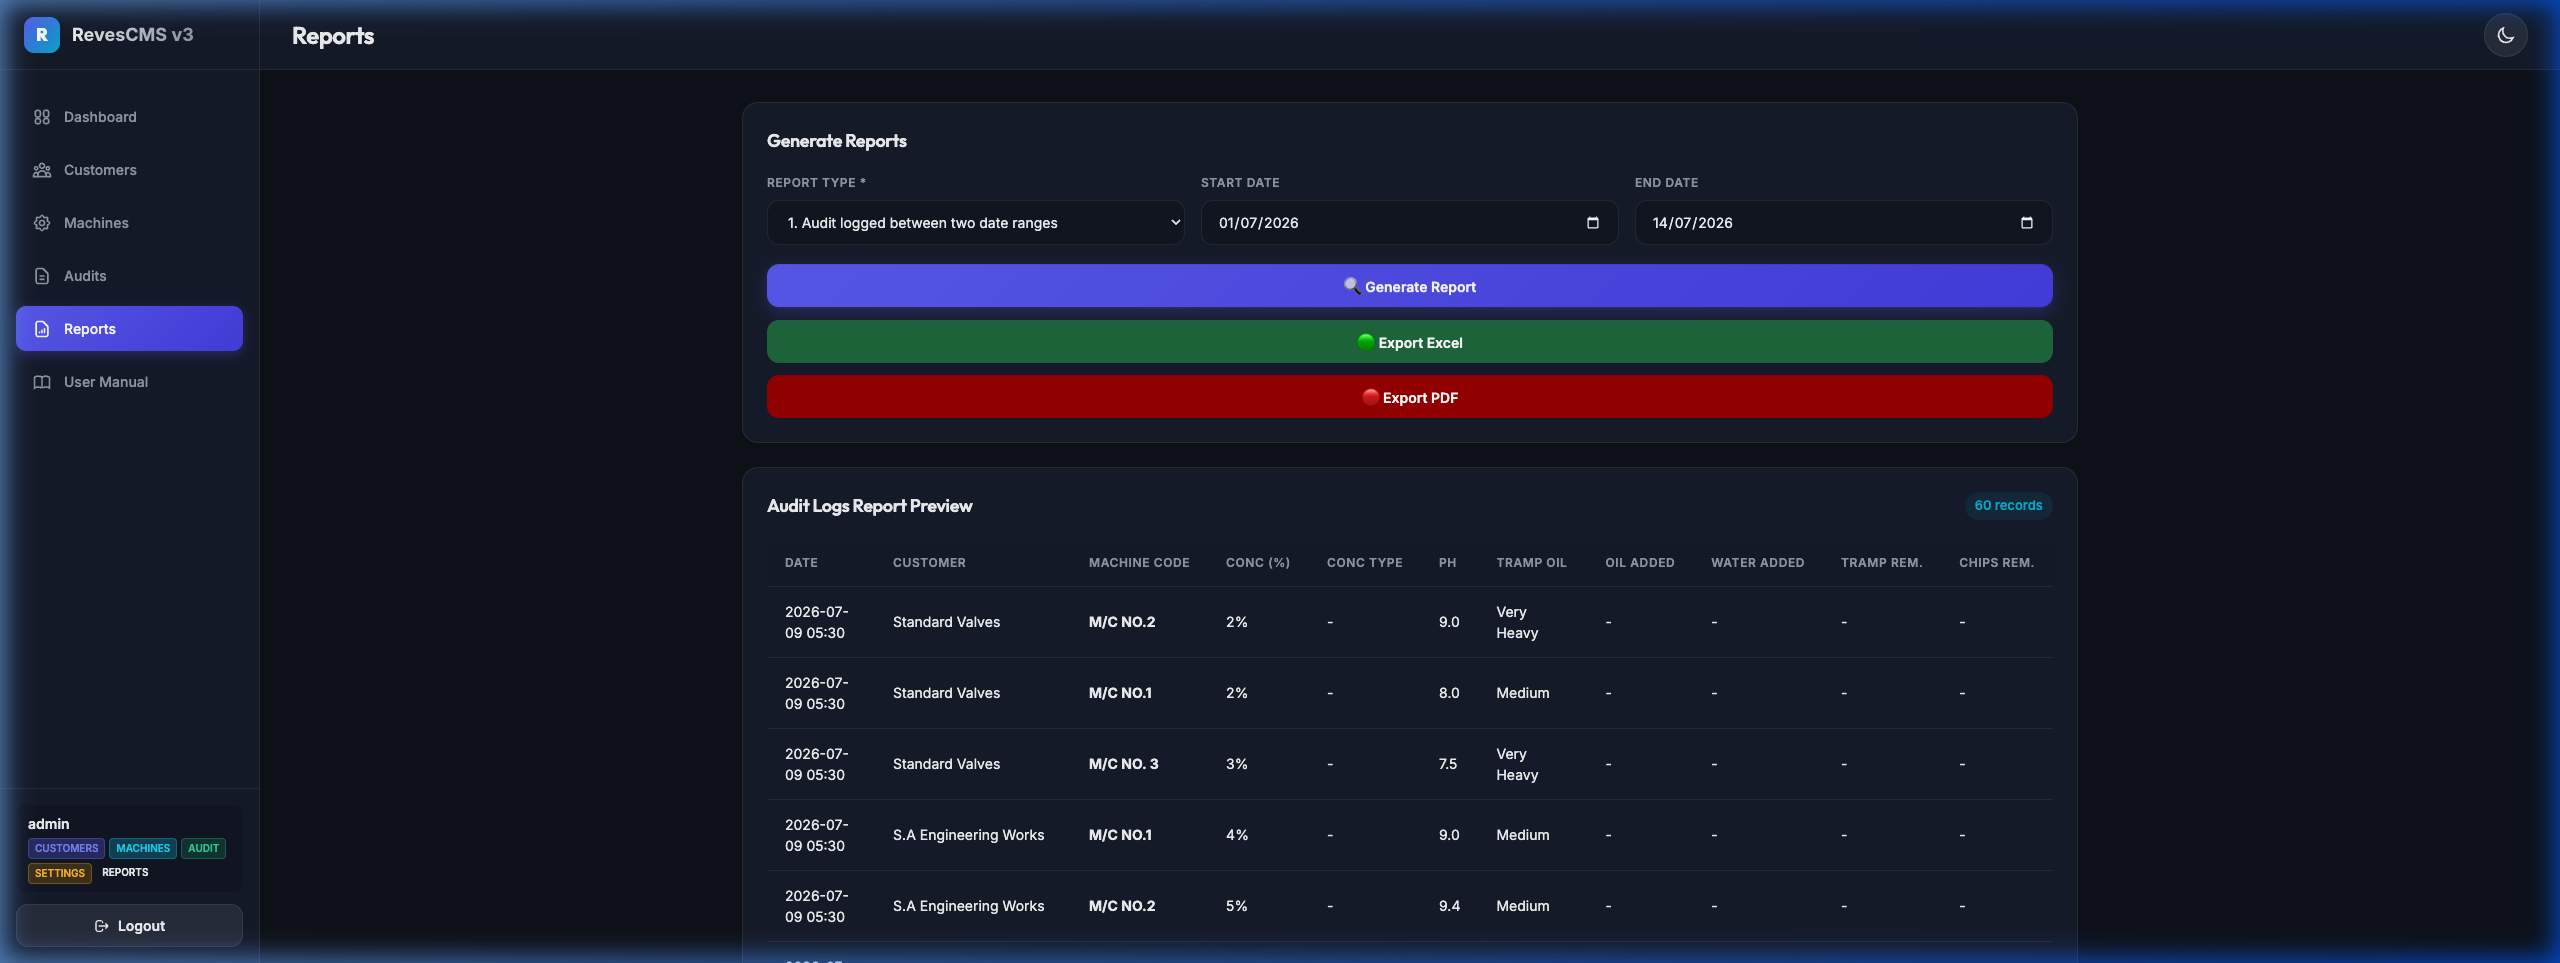
Reports Results
Fig 6.2 — Report Preview Table with Export Options

6.2 Exporting Reports

1After generating a report, the "🟢 Export Excel" and "🔴 Export PDF" buttons appear above the table.
2Click "Export Excel" to download a spreadsheet (.xlsx) with all report data including column headers.
3Click "Export PDF" to download a formatted, landscape-oriented PDF file with the report title and generation timestamp.
4Files are named automatically with the report type and today's date (e.g., report_1_2026-07-14.pdf).
💡 Tip: Export Excel is ideal for further data analysis in spreadsheet tools. Export PDF is best for printing or sharing formal records.
🔐

7. Roles & Permissions

Access to modules is controlled by roles assigned to each user account. Your current roles are displayed in the sidebar at the bottom left.

RoleGrants Access To
customersView, Add, Edit, Delete Customers
machinesView, Add, Edit, Delete Machines
auditView, Log, Edit, Delete Audit Records
reportsAccess the Reports module, generate and export reports
settingsManage portal settings (admin only)
💡 Note: The Dashboard and Help tabs are accessible to all logged-in users regardless of roles.
🌙

8. Theme Toggle (Dark / Light Mode)

RevesCMS v3 supports both Dark Mode and Light Mode.

1Look for the ☀️ / 🌙 theme toggle button in the top right of the header bar.
2Click it to switch between Dark Mode and Light Mode instantly.
3Your preference is saved in your browser and will be restored on your next visit.
💡 Tip: Date pickers and native form controls automatically adapt to the selected theme.
📋

9. Onsite Visit Log

The Onsite Visit Log module (accessible to users with the audit role) allows you to log and track detailed coolant cleaning, filtration, and maintenance activity performed onsite using a structured 9-step SOP wizard.

9.1 Logging a New Onsite Visit

1Navigate to the Onsite Visit Log tab in the sidebar.
2Click the "+ Log Onsite Visit" button. This opens the multi-step form wizard.
3Step 1 (Primary Info): Select the Customer Name. The Customer Contact will auto-populate. Choose the Machine. The read-only details (Tank Size, Machine Type, Coolant Name, and Tank Access) will automatically display as clean, non-editable value cards. Click Next.
4Step 2 (Job & Condition): Select the Type of Work (Online/Offline Filtration, or Oil Change). Enter remarks for Coolant Condition, and use the range sliders to set Initial Concentration (%) and Initial pH. Click Next.
5Step 3 (SOP Steps): Complete the 9 SOP steps. Select Yes/No answers and enter details for tramp oil removal method, sump cleaner type, vacuum cleaner used, jet spray type, mop type, filter micron, etc. Click Next.
6Step 4 (Post & Sign-off): Use the range sliders to set the Post Concentration (%) and Post pH. Write Final Remarks, type the names of the Reves Rep and Customer Rep as digital sign-offs, and click "Save Log" to submit.

9.2 Filtering and Searching Log Entries

You can filter the logs table at any time using the search control bar located above the data table:

  • Select a Customer to filter logs.
  • After selecting a customer, the Machine dropdown activates so you can narrow down logs to a specific machine.
  • Provide Start and End Dates to restrict logs to a specific timeframe. Click "Clear" to reset the filters.

9.3 Row Actions (View, Edit, Print)

Each entry in the table has three distinct actions:

  • 👁 View: Opens the wizard modal in read-only mode. You can navigate through all steps of the logged SOP, but cannot make edits.
  • ✎ Edit: Re-opens the wizard form in editable mode to update and resubmit the logged values.
  • 🖨 Print: Generates a clean, print-ready document mimicking the official SOP CMS DATA sheet. Perfect for printing to a physical printer or saving as a PDF file.